Data visualisation and dashboards
When done well, data visualisation can be an effective tool in helping us identify patterns, generate insights and tell the story behind data.
Interactive dashboards can take these concepts a step further. Our in-house capabilities allow us to tailor visualisations to the diverse needs and preferences of our partners, utilising infographics, animations, maps and a wide range of charts. We develop bespoke dashboards that allow partners to intuitively explore complex data sets or share their impact with others in an accessible way.

Women’s Integrated Sexual Health Programme (WISH) Third Party Monitoring
Itad, together with OPM, has been selected by the Foreign, Commonwealth and Development Office (FCDO) to lead on evidence...

Impact evaluation of the Millennium Villages project in Northern Ghana
Billions of people live in extreme poverty. The Millennium Villages project is a bold attempt to lift rural African...

Partnership to Engage, Reform and Learn (PERL) – Accountable, Responsive and Capable Government Pillar
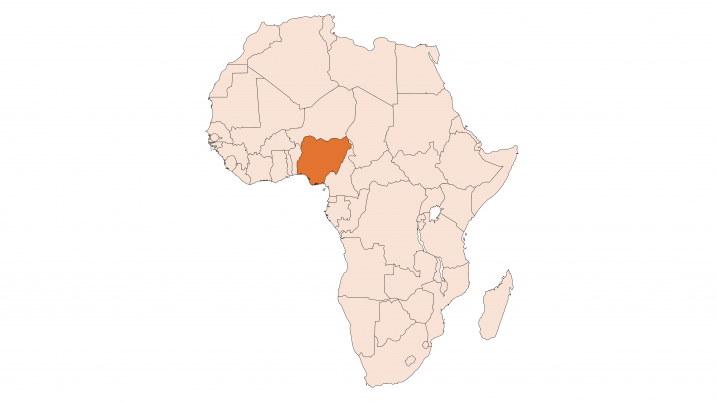
Although Nigeria has made progress with socio-economic development in recent years, about 90 million people - roughly half...
Publications

Women’s Integrated Sexual Health (WISH) Programme for Results: independent verification, evidence, and learning
An evidence gap map on ‘what works’ to ensure persons with disabilities have access to sexual reproductive health services...

Adaptive Programming in Fragile, Conflict and Violence-Affected Settings – What works and under what conditions? The Case of PERL, Nigeria
This case study focuses on PERL (Partnership to Engage, Reform and Learn) in Nigeria and draws on a conceptual framework (the...
Articles

Building back better: How we are realising the potential of digital technology for MEL
Over this past year, the COVID-19 pandemic has had a profound effect on our lives, including our ways of working. Technology...

Access to SRH services for persons with disabilities: mapping the evidence
A growing body of evidence shows that persons with disabilities have historically been denied their SRH (sexual and...
Is open access worth it? Maybe not yet, but we should still do it!
During the impact evaluation of the Millennium Villages project in northern Ghana, we opened up our datasets for wider...

Does adaptive programming work in fragile contexts, and why? The case of PERL in Nigeria
We’ve just published a case study based on a fascinating week in Nigeria last summer, exploring what ‘adaptive...

